
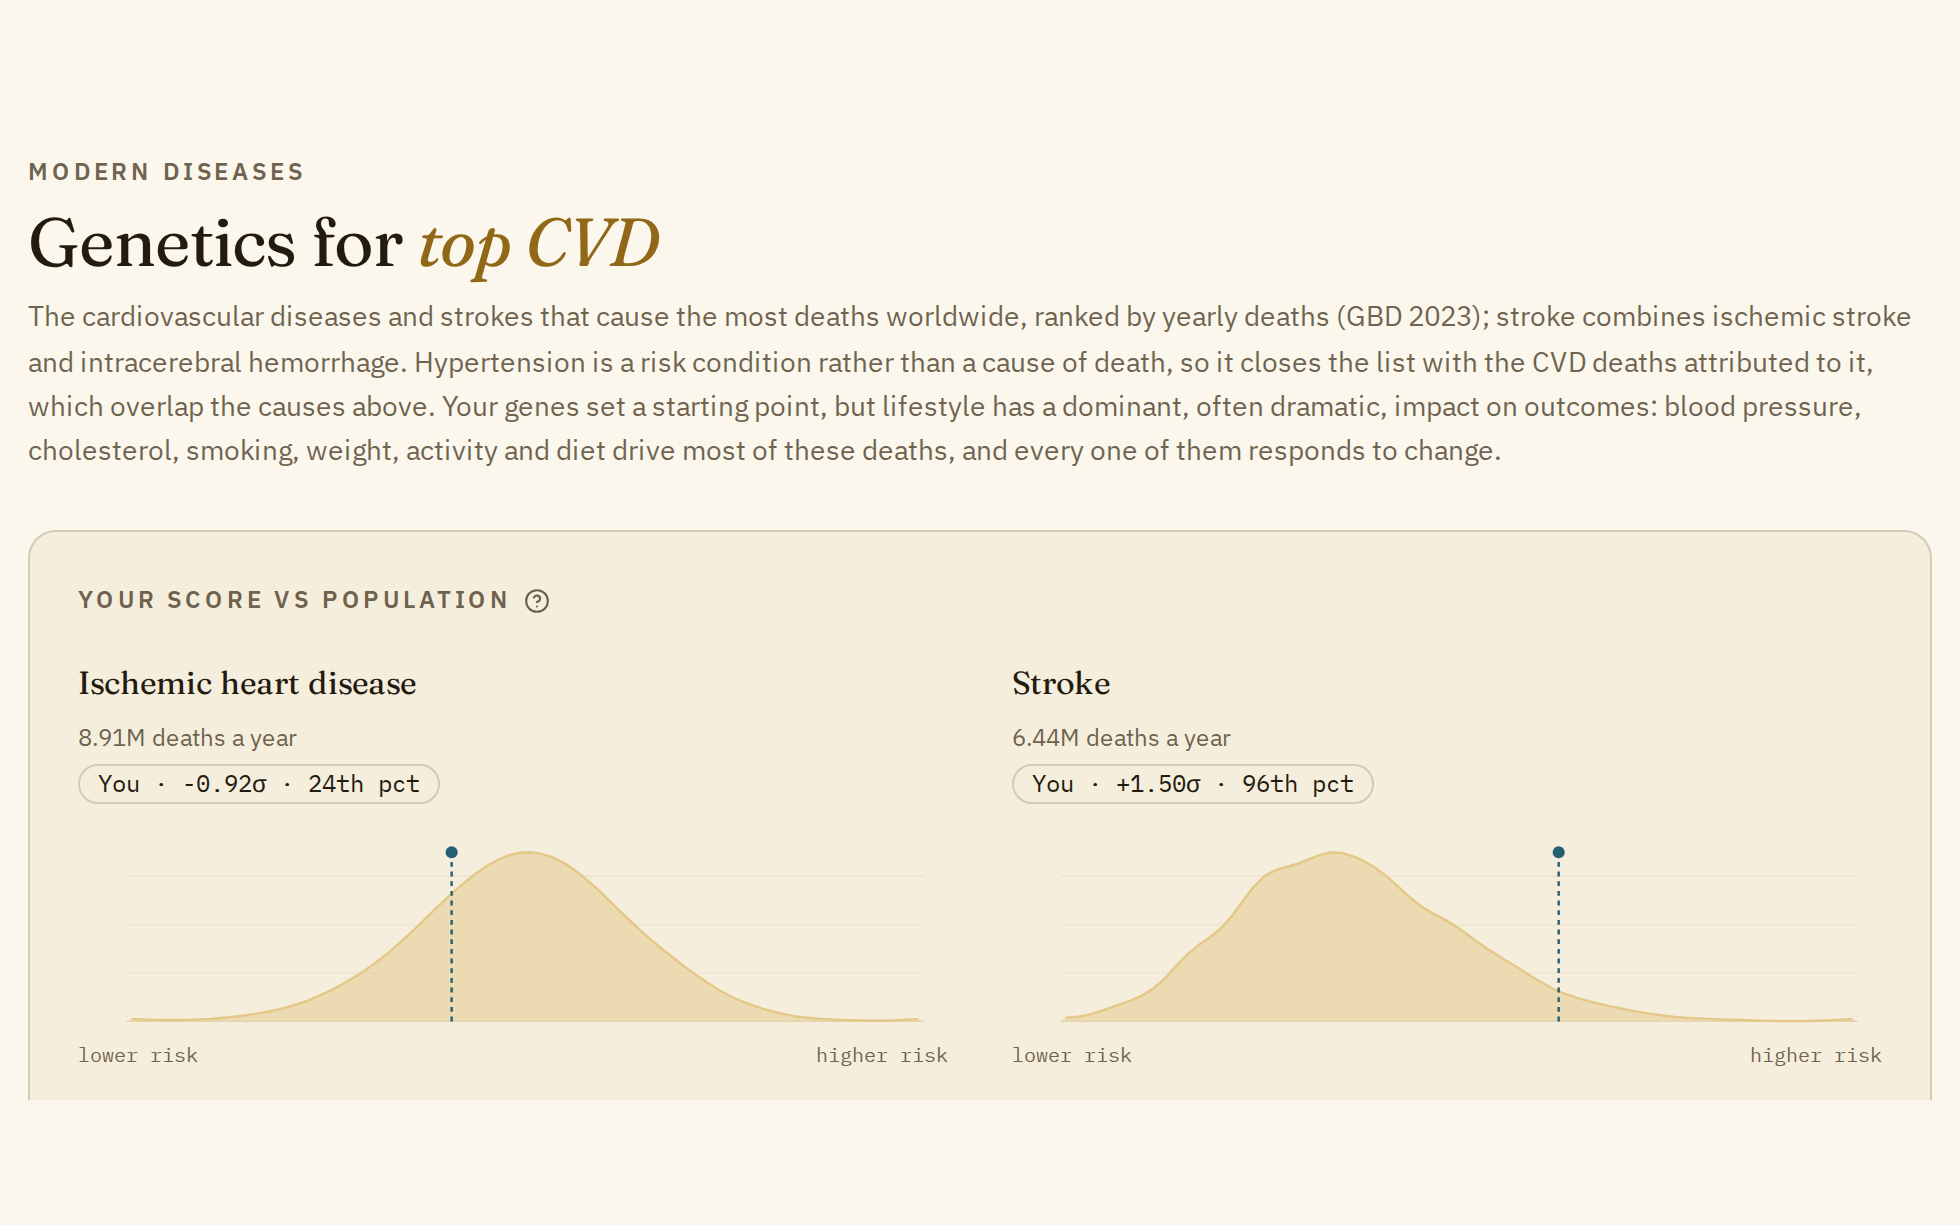
Three pages in the left menu, under "Modern diseases", group the diseases behind most deaths worldwide: Cancers, CVD - Cardio & Stroke and Metabolic syndrome. Each one lists the main diseases in that area with your polygenic score for each, then a table of the measurements doctors use to track them.
Where the numbers come from
The ranking and the yearly deaths. Each disease is listed with how many people it kills worldwide each year:
- Cancers use GLOBOCAN 2024, the global cancer estimates from the International Agency for Research on Cancer.
- CVD and Metabolic syndrome use the Global Burden of Disease study (GBD 2023). Obesity is the one exception, with its figure from GBD 2021.
Hypertension, obesity and high cholesterol are risk conditions, not causes of death, so they're shown with the deaths attributed to them. Those overlap with the diseases above them and with each other, which is why they aren't ranked on the same scale. Metabolic syndrome itself has no death estimate.
Your score. Each chart is a polygenic score built from published GWAS results in the GWAS Catalog, and your percentile ranks you against real scored genomes. Understanding your reports explains how to read one.
A few diseases are scored through a closely related report, and the chart says so. For example, "via brain aneurysm" for subarachnoid hemorrhage.
Cancers and measurements that apply to only one sex, such as prostate or breast cancer, appear only for that sex, inferred from your DNA.
Reading a chart
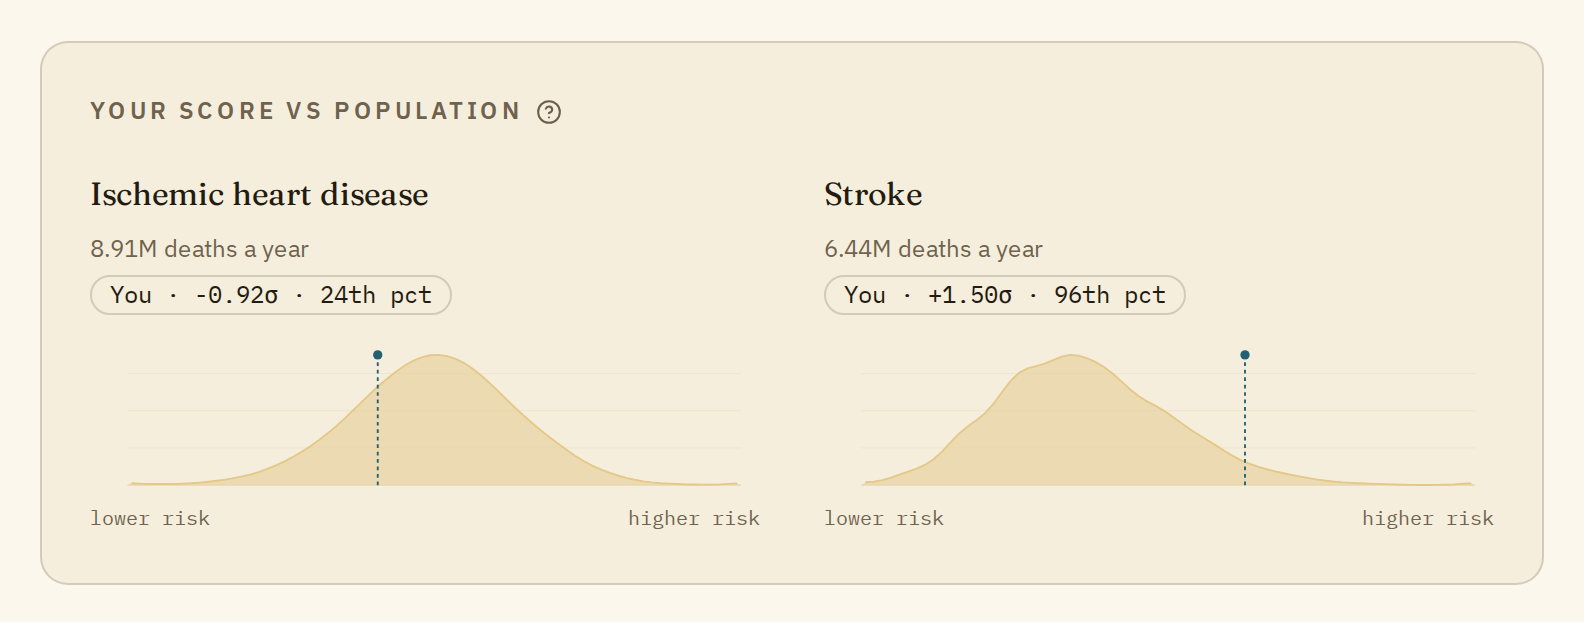
Each chart shows:
- the disease and its yearly deaths worldwide;
- your score and percentile, for example
You · -0.92σ · 24th pct; - the population curve, from lower risk on the left to higher risk on the right, with the dashed line at your score.
A percentile is a rank, not a forecast. The 24th percentile means your score is higher than about 24% of the tested population. Most people at any percentile never develop the disease, and a low score doesn't rule it out.
Click a disease's name to open its full report, with the variants behind your score.
The measurements
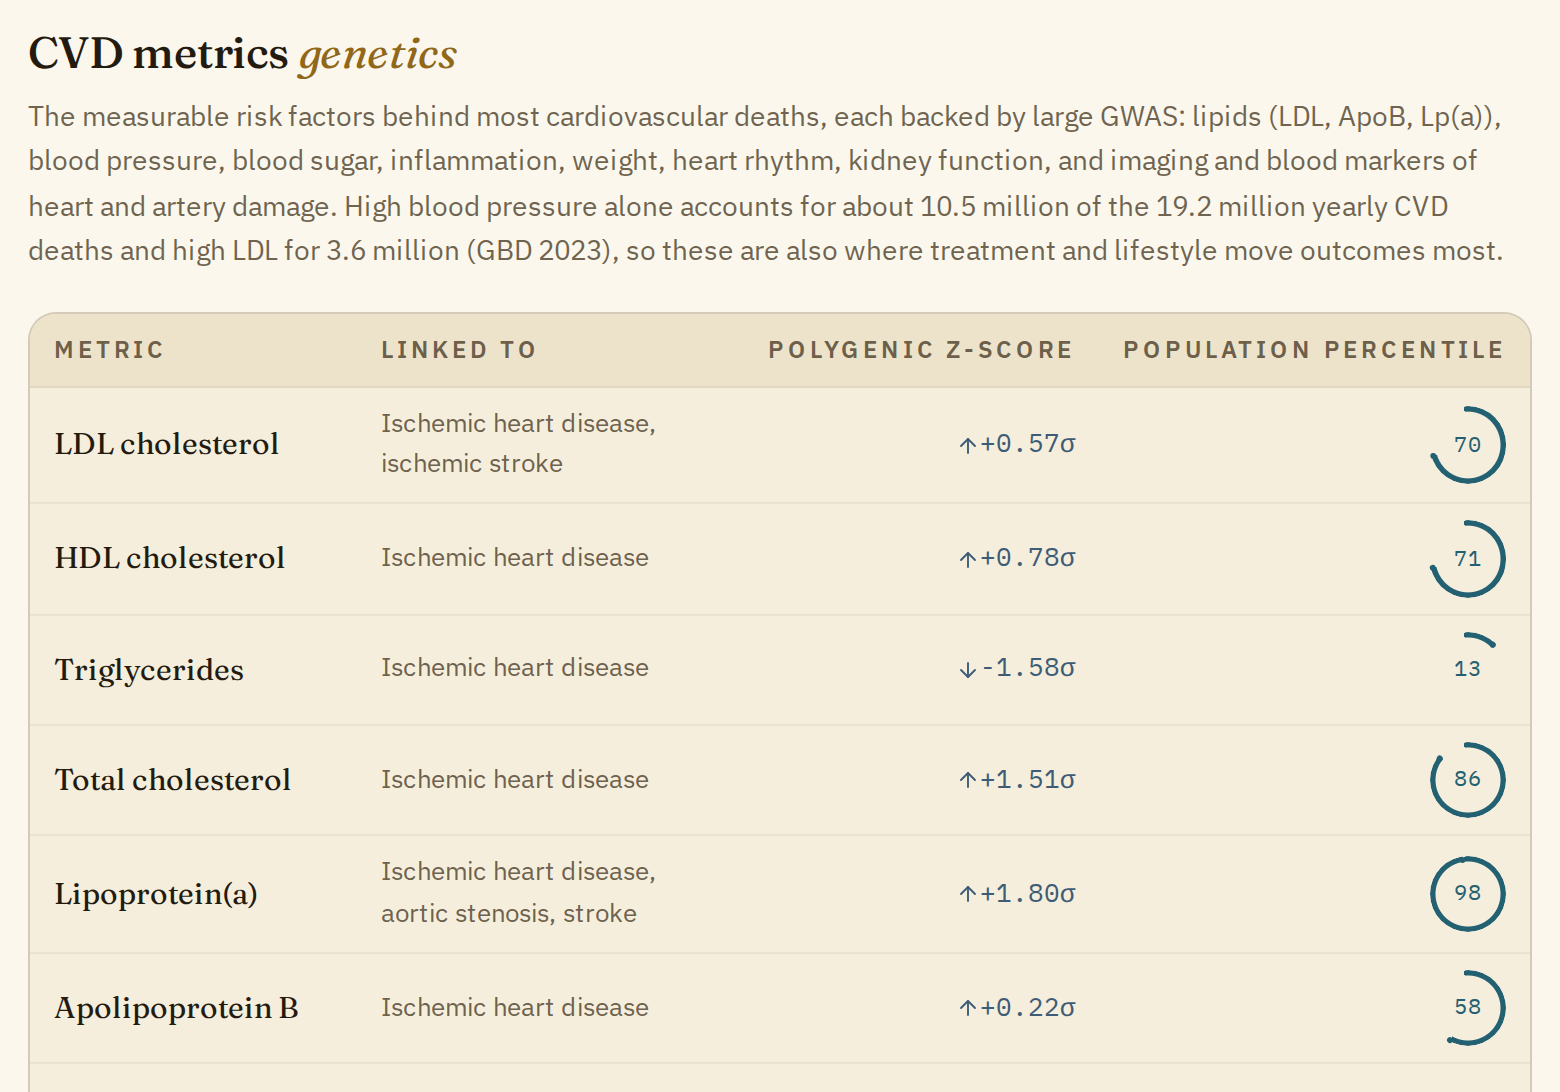
Below the charts, a table lists about 20 measurements for each page, each with your score and percentile and the diseases it's linked to.
- Cancers: tumor markers doctors already measure (PSA, CEA, AFP, CA19-9), precursor conditions such as colorectal adenoma, Barrett's oesophagus and MGUS, the sex hormones and IGF-1, skin pigmentation, and smoking intensity.
- CVD: cholesterol and other lipids such as LDL, ApoB and Lp(a), blood pressure, blood sugar, inflammation, weight, heart rhythm and kidney function. High blood pressure alone accounts for about 10.5 million of the 19.2 million yearly CVD deaths, and high LDL for 3.6 million (GBD 2023).
- Metabolic syndrome: the five measures that define it (waist, triglycerides, HDL cholesterol, blood pressure and fasting glucose), plus long-term blood sugar, insulin resistance, liver fat, uric acid and two hormones made by fat tissue.
These are worth a look because they're things you can measure, and for most of them treatment and lifestyle change the result. Each one opens its own report.
Lifestyle comes first
Every page says it plainly: your genes set a starting point, but lifestyle has a much bigger say in what happens.
- Cancers: not smoking, drinking less, a healthy weight, staying active, preventing or treating the infections linked to cancer (HPV, hepatitis B and C, H. pylori), and regular screening.
- CVD: blood pressure, cholesterol, smoking, weight, activity and diet drive most of these deaths, and all of them respond to change.
- Metabolic syndrome: weight, diet, activity, sleep and alcohol move every one of these.
One more thing
Think of these pages as an interesting starting point for a conversation with a qualified clinician. They're not medical advice or a diagnosis. This is data assembled and summarized by AI from public scientific sources. It may contain errors despite our automatic checks and manual reviews, which are ongoing given how much content there is.