
This guide walks you through a report page, shows where to find your reports, and explains how they relate to the full report and the report groups. The example is the omega-3 fatty acids report from the demo report.
Reading a report page
The chart
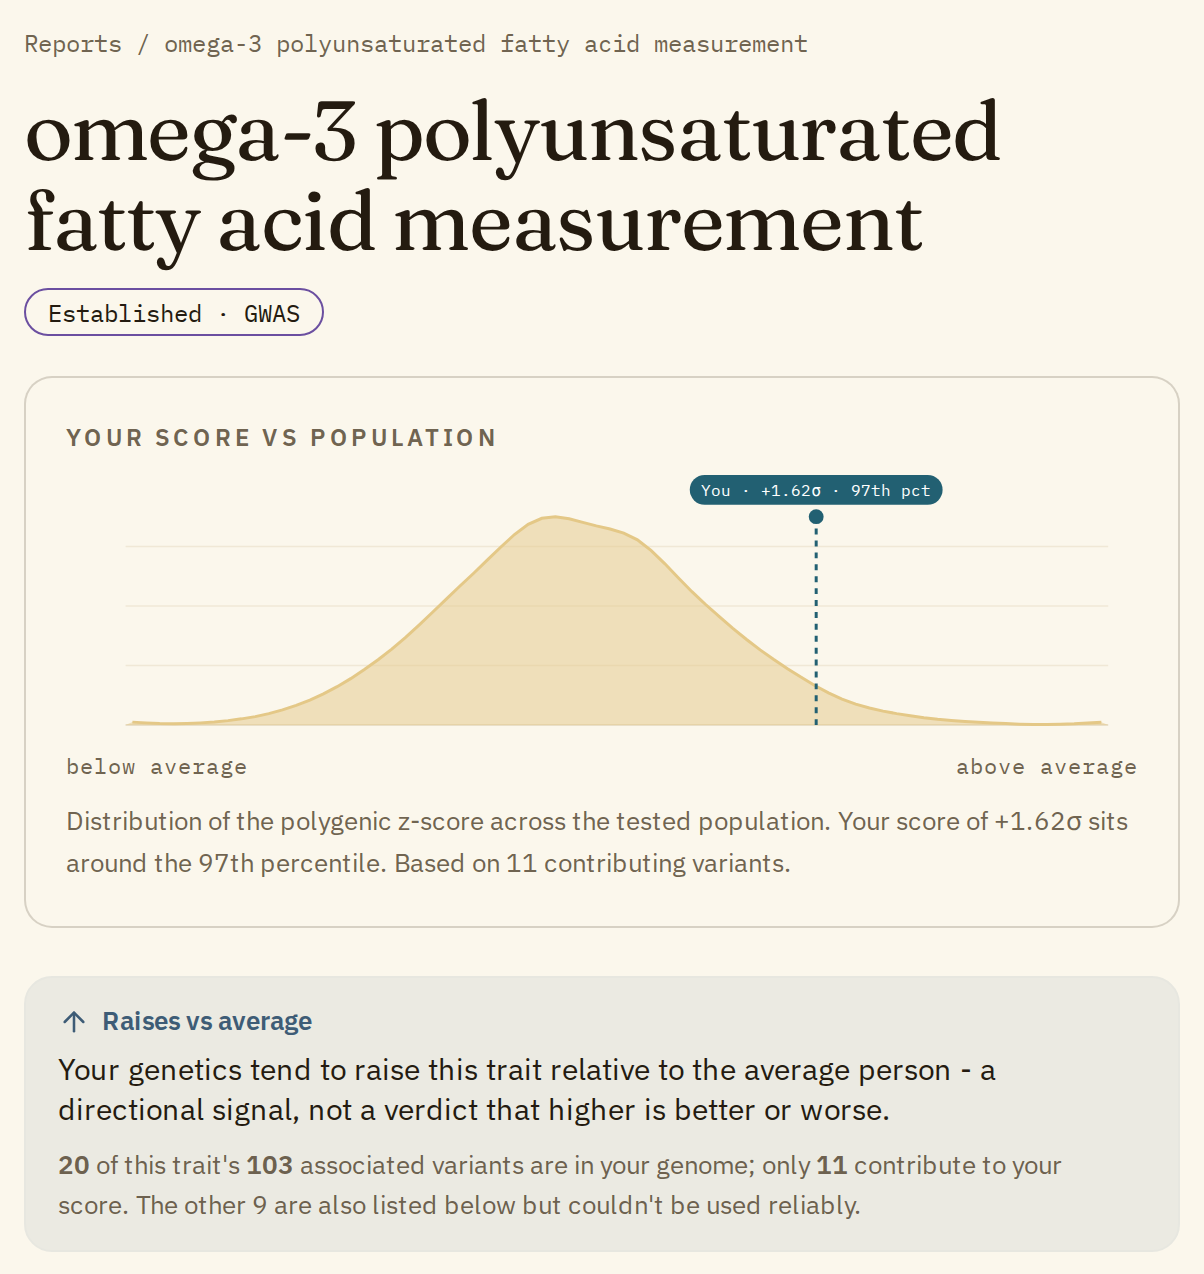
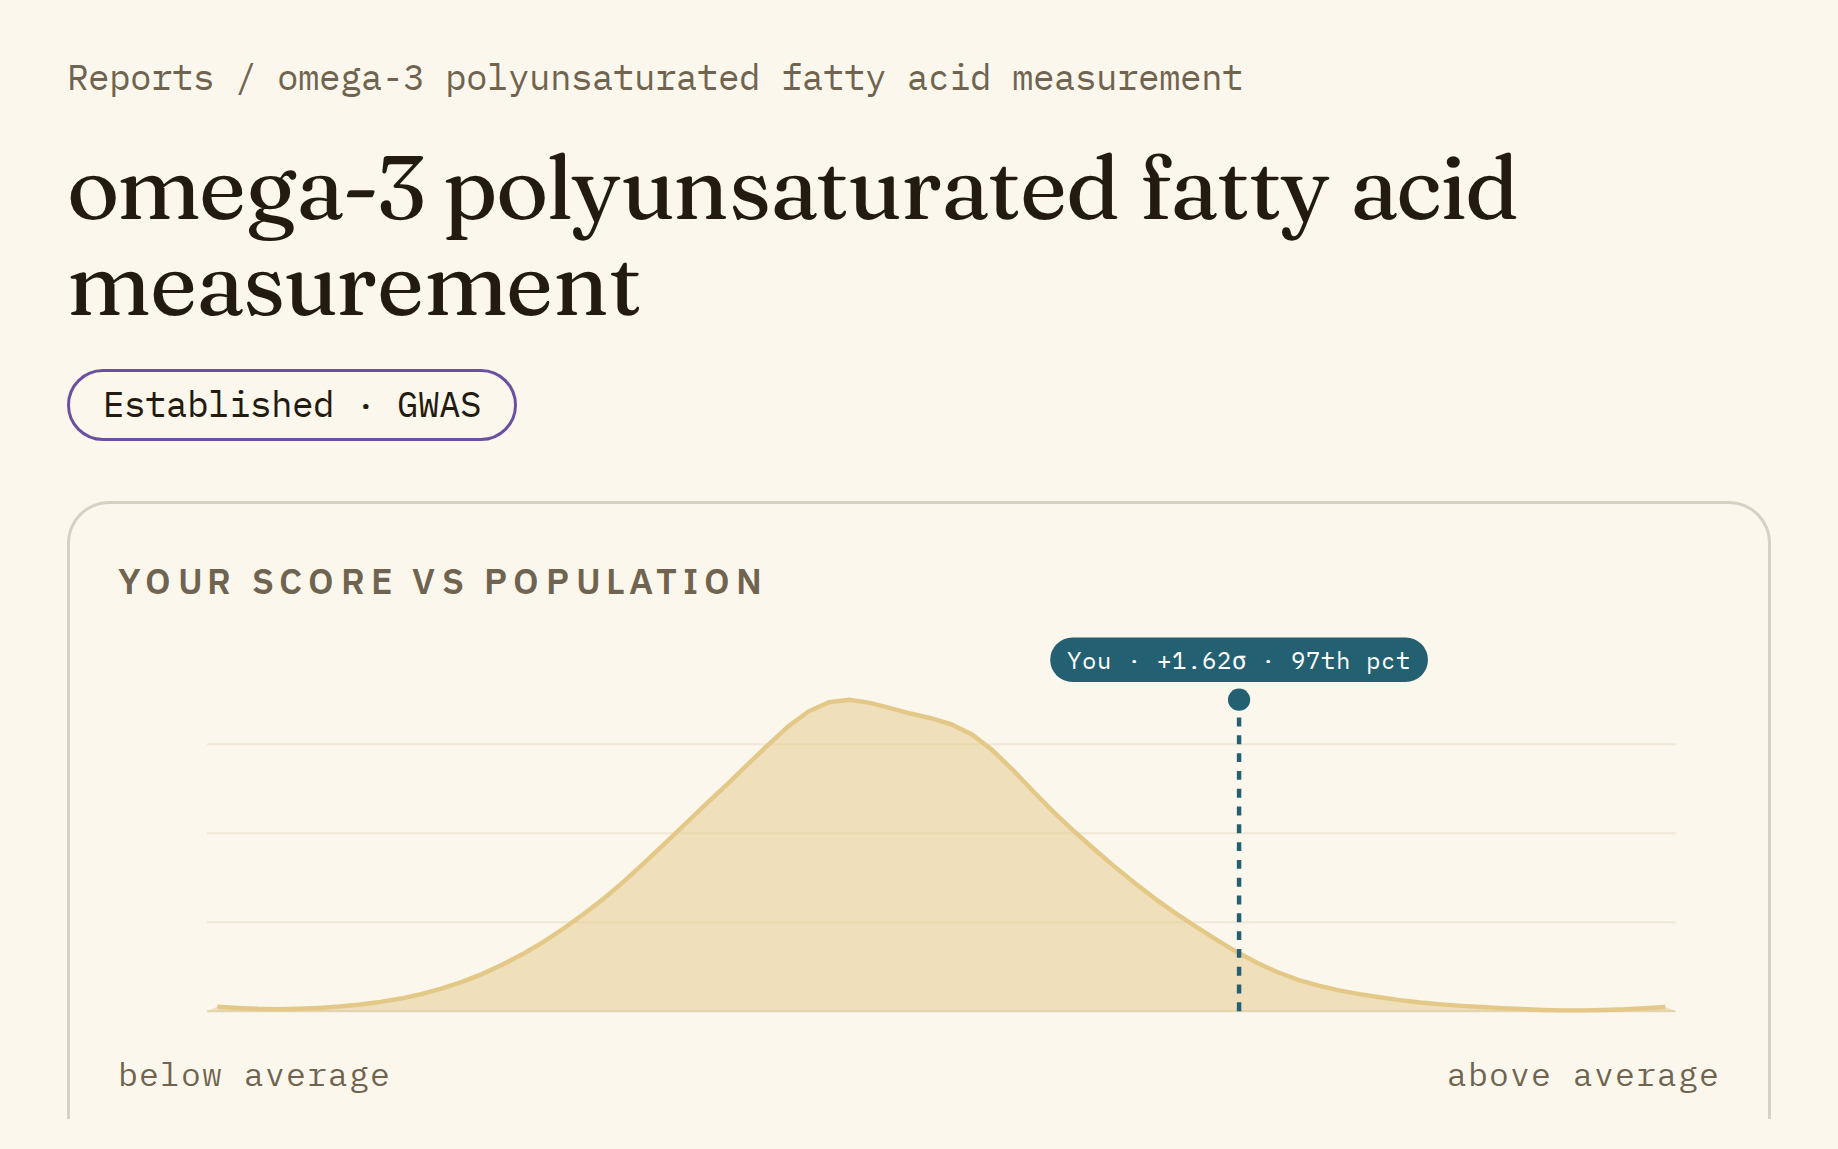
The curve is the tested population: how many people got each score. The dashed line is you, labeled with your score and percentile, here You · +1.62σ · 97th pct.
- The score is in standard deviations (σ) from the population average.
0σis exactly average. - The percentile is your rank: your score is higher than about 97% of the tested population.
The Established · GWAS badge means only replicated, genome-wide significant associations feed this score.
What it means for you
The box under the chart explains your result in plain words. Here it says "Raises vs average", meaning your genetics tend to push this trait up compared with the average person. For a measurement like omega-3 that's a direction, not a verdict that higher is better or worse. For a disease report, a higher score means a higher inherited tendency. It's still not a diagnosis or the chance you'll get it.
The same box says how many of the trait's associated variants are in your genome, and how many of those contribute to your score. The ones that don't are still listed, but couldn't be used reliably.
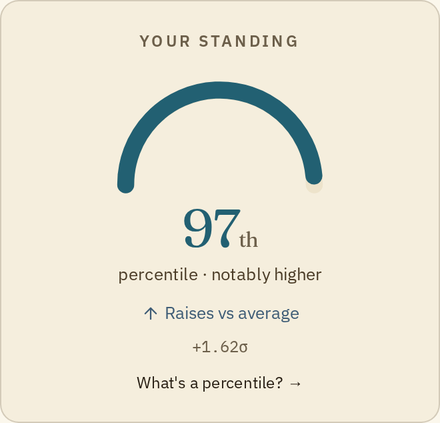
On a wide screen, "Your standing" on the right shows the same percentile as a gauge, with a link to "What's a percentile? →".
About this trait
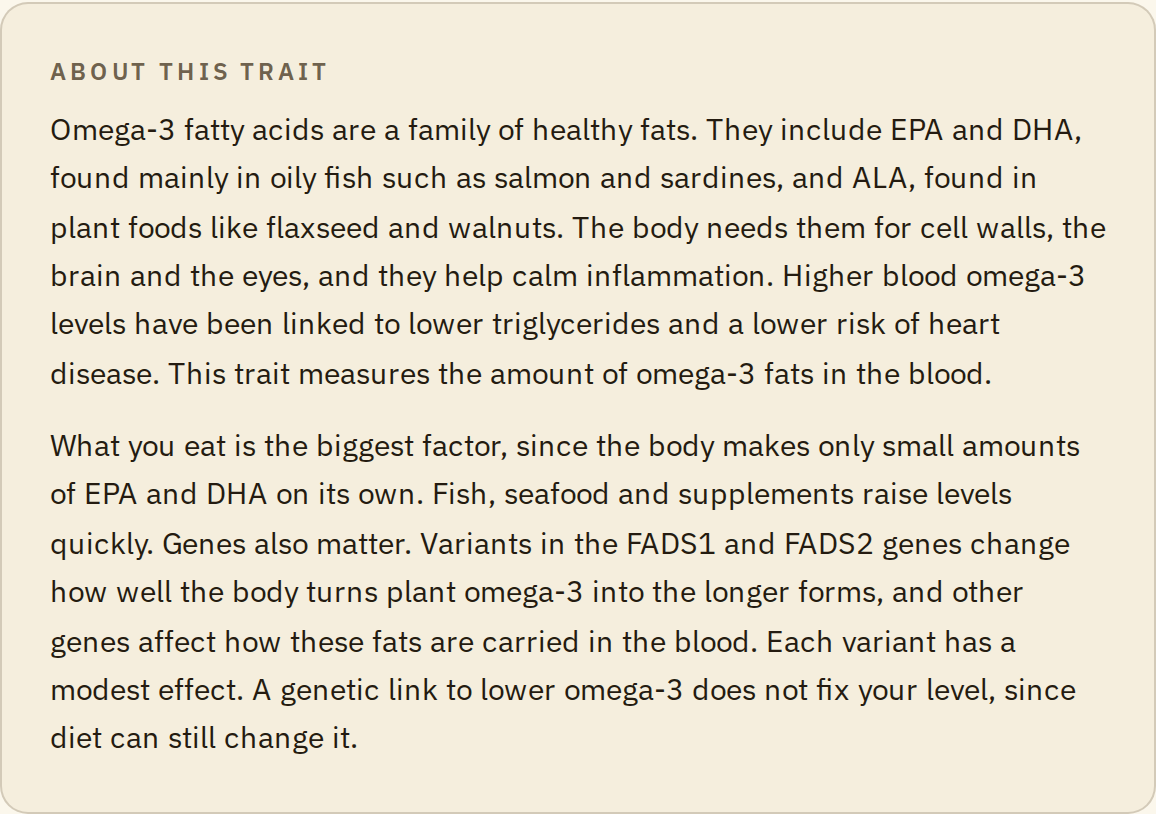
A plain-language description of what the trait is, what affects it, and how much genes matter compared with everything else. For omega-3 the answer is clear: diet sets most of your level. Your genes nudge how well you convert the plant forms into EPA and DHA. Only a blood test, the omega-3 index, measures your actual level.
Your contributing variants
"Evidence - your contributing variants" lists the variant cards behind your score. Above each card, a small badge says what that variant does to this score.
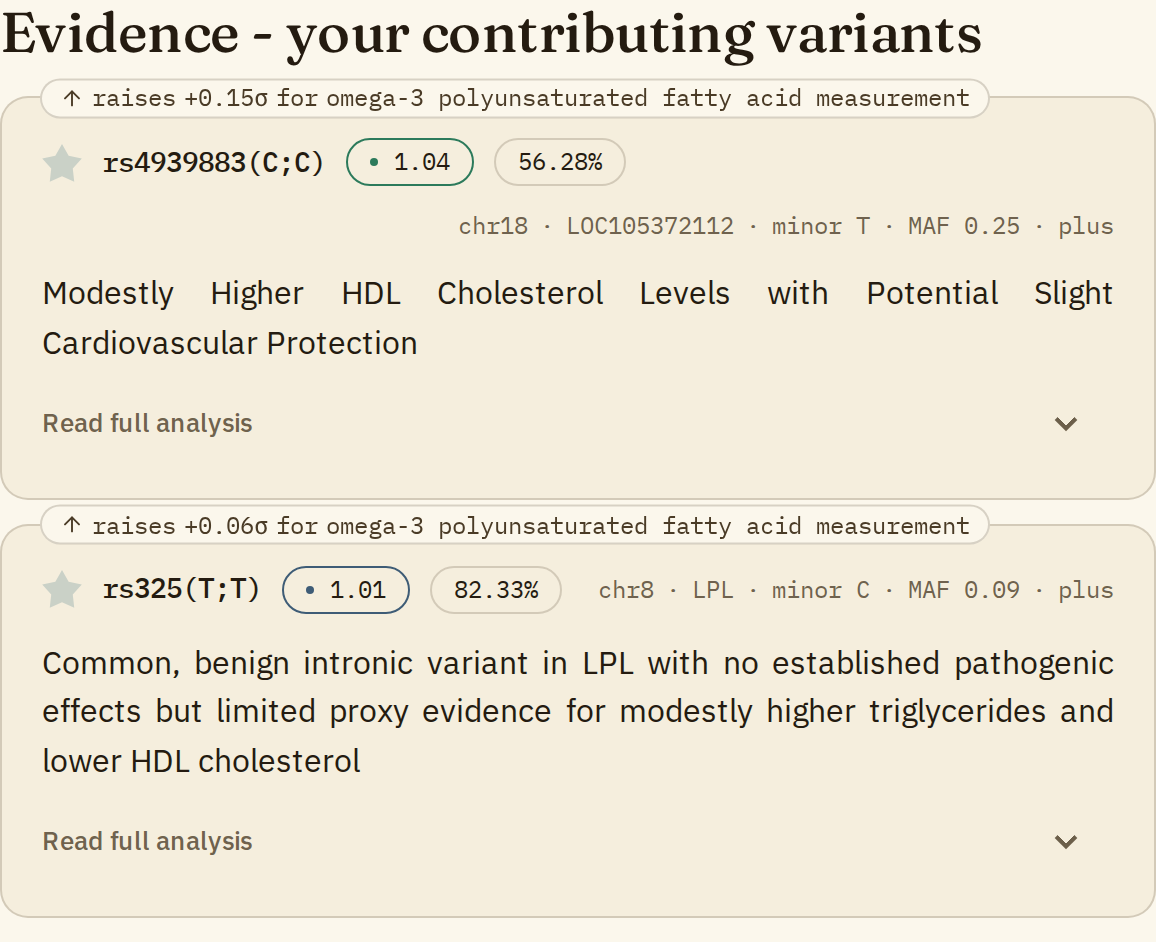
raises +0.15σ for omega-3 polyunsaturated fatty acid measurement means this variant moves your score up by 0.15σ. Hover over the badge to see the study result behind it. A variant marked not scored is in your genome but couldn't be used: the study gave no usable effect size, the variant is too rare to weigh reliably, or it's a variant group rather than a single variant. Hover over the badge to see which. Each card opens like any other variant card.
References and related reports
Under the variant list, "References from your contributing variants" collects the studies cited by those variants, without duplicates. Because one variant can matter for many traits, some of these papers are about other conditions.
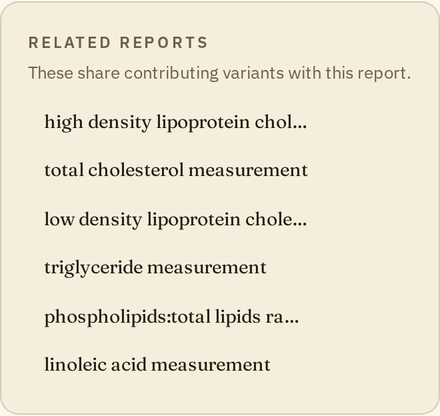
On the right, "Related reports" lists the reports that share contributing variants with this one: for omega-3, mostly other blood lipids. Below it, "How the score works" sums up the method in a few lines, with key references on polygenic scores.
Finding a report
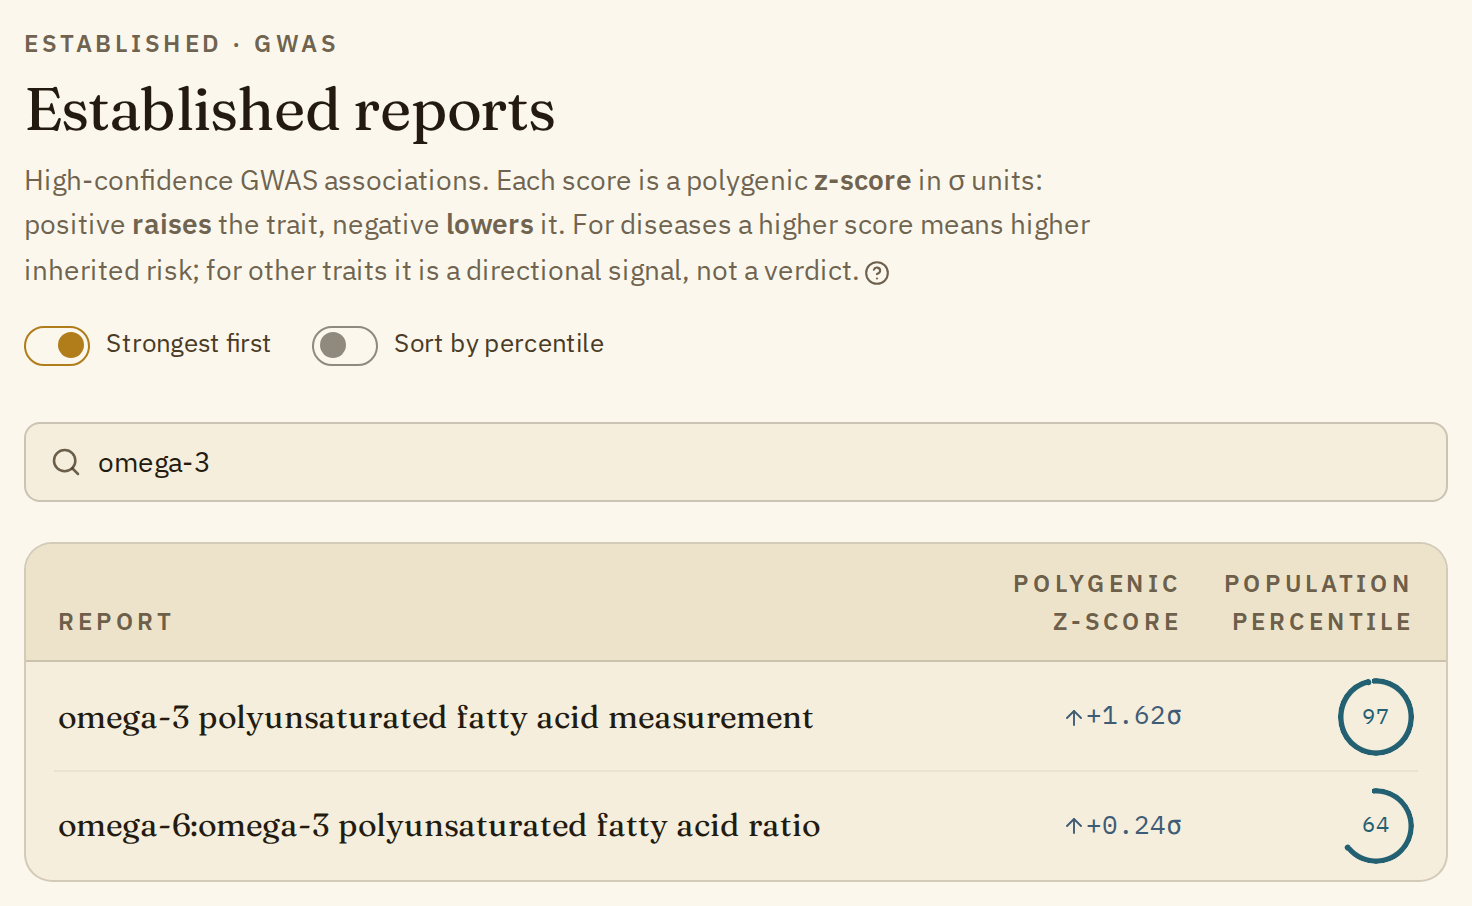
From the Reports list. "Reports" in the top menu opens the list of established reports. Each row shows the report, your polygenic z-score and your population percentile. Use "Find an established report…" to search it, and "Strongest first" or "Sort by percentile" to reorder it.
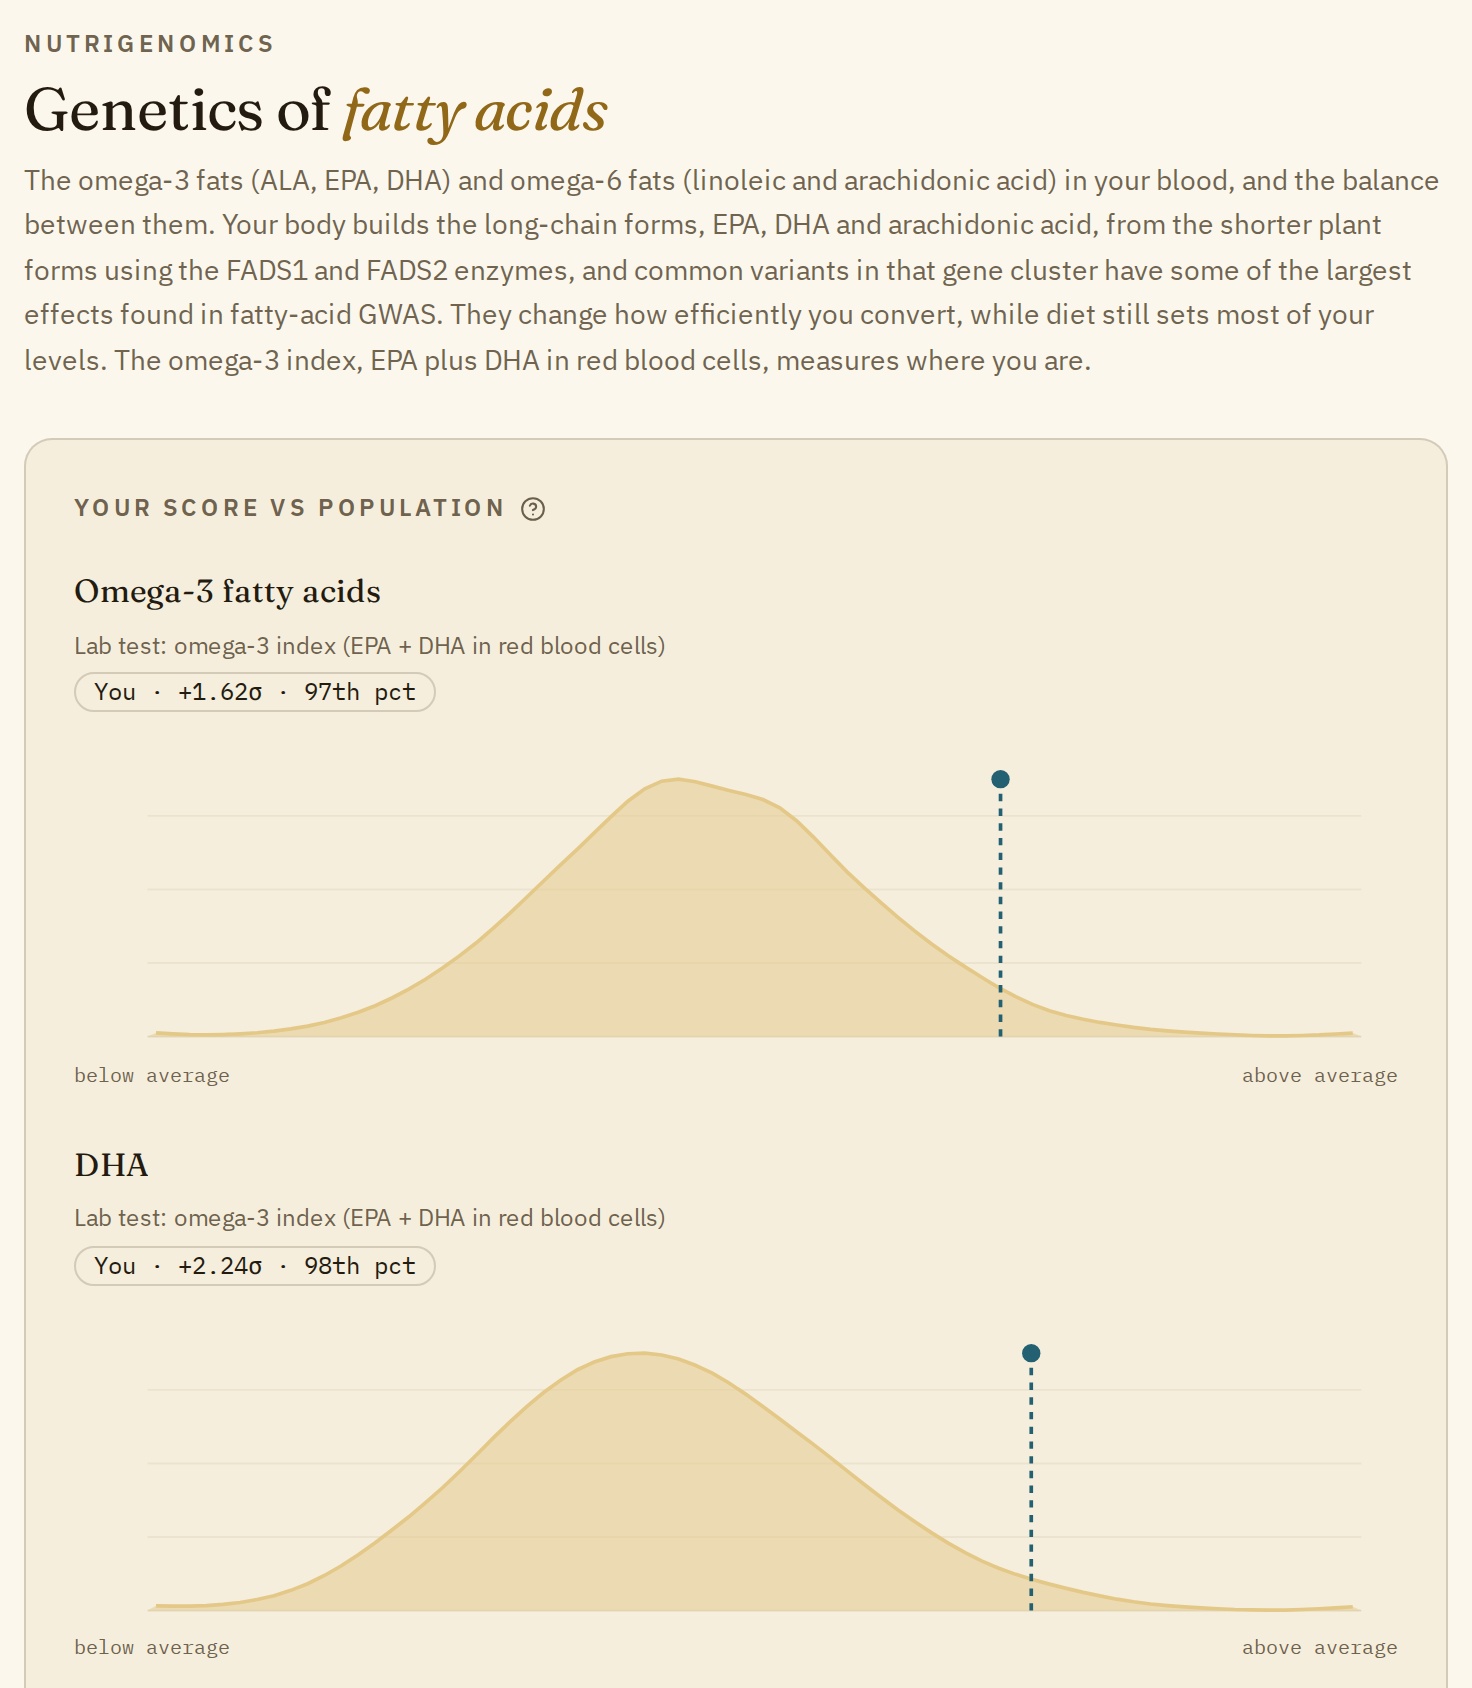
From a group of reports. On a group page such as Fatty acids, the name above each chart links to its report. The chart is a small version of the one on the report page.
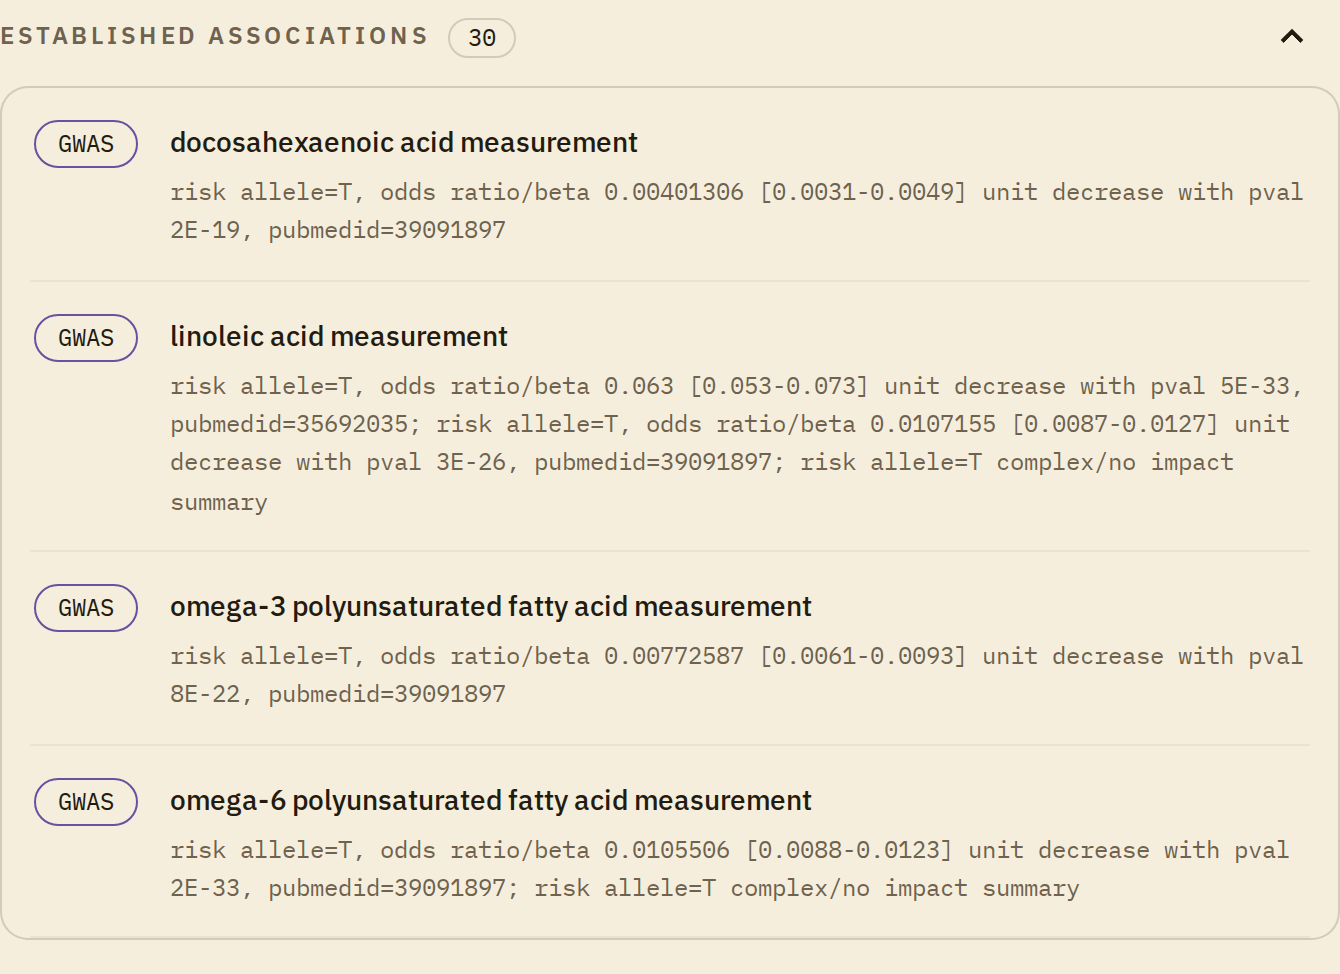
From a variant card. Open "Read full analysis" on any card, then "Established associations". Every trait in that list links to its report. Here rs4939883, a variant linked to HDL cholesterol, lists DHA, linoleic acid, omega-3 and omega-6 among its 30 associations.
You'll also find report links on the dashboard and under "Related reports" on every report page.
The full report, reports and report groups
The full report is every variant in your file that we have a summary for, as one searchable list of variant cards. Open it with "Full report" in the top menu.
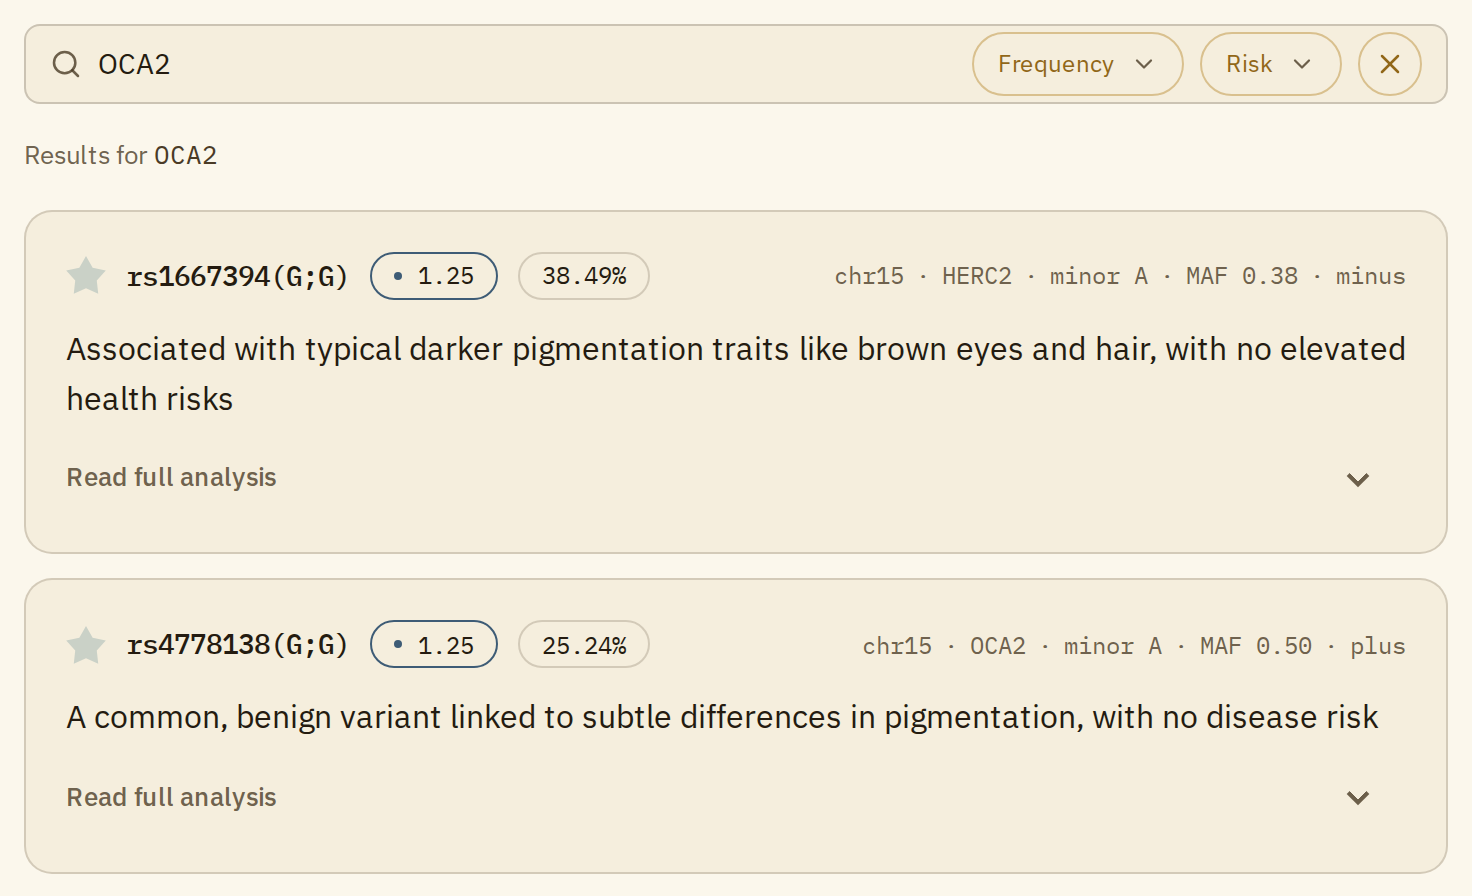
Type a disease, drug, gene or rsID in the search box, then narrow the results with the "Frequency" and "Risk" filters. Each result is a variant card; Variant geno card explained walks through one.
A report covers one trait or condition, such as omega-3 levels, body height or type 2 diabetes. It brings together every variant studies have linked to that trait and adds up their effects into one polygenic score. This is what most of the site means by "report".
A group of reports collects related reports on one page, each with its own chart. The left menu lists them under two headings: "Modern diseases" (Cancers, CVD - Cardio & Stroke, Metabolic syndrome) and "Nutrigenomics" (Fat-soluble vitamins through Food tolerance).
One more thing
A report shows an inherited tendency compared with the tested population. Most people at any percentile never develop the condition a disease report covers, and for measurements like omega-3 a lab test tells you where you actually are. Think of a report as an interesting starting point for a conversation with a qualified clinician, not as medical advice.