
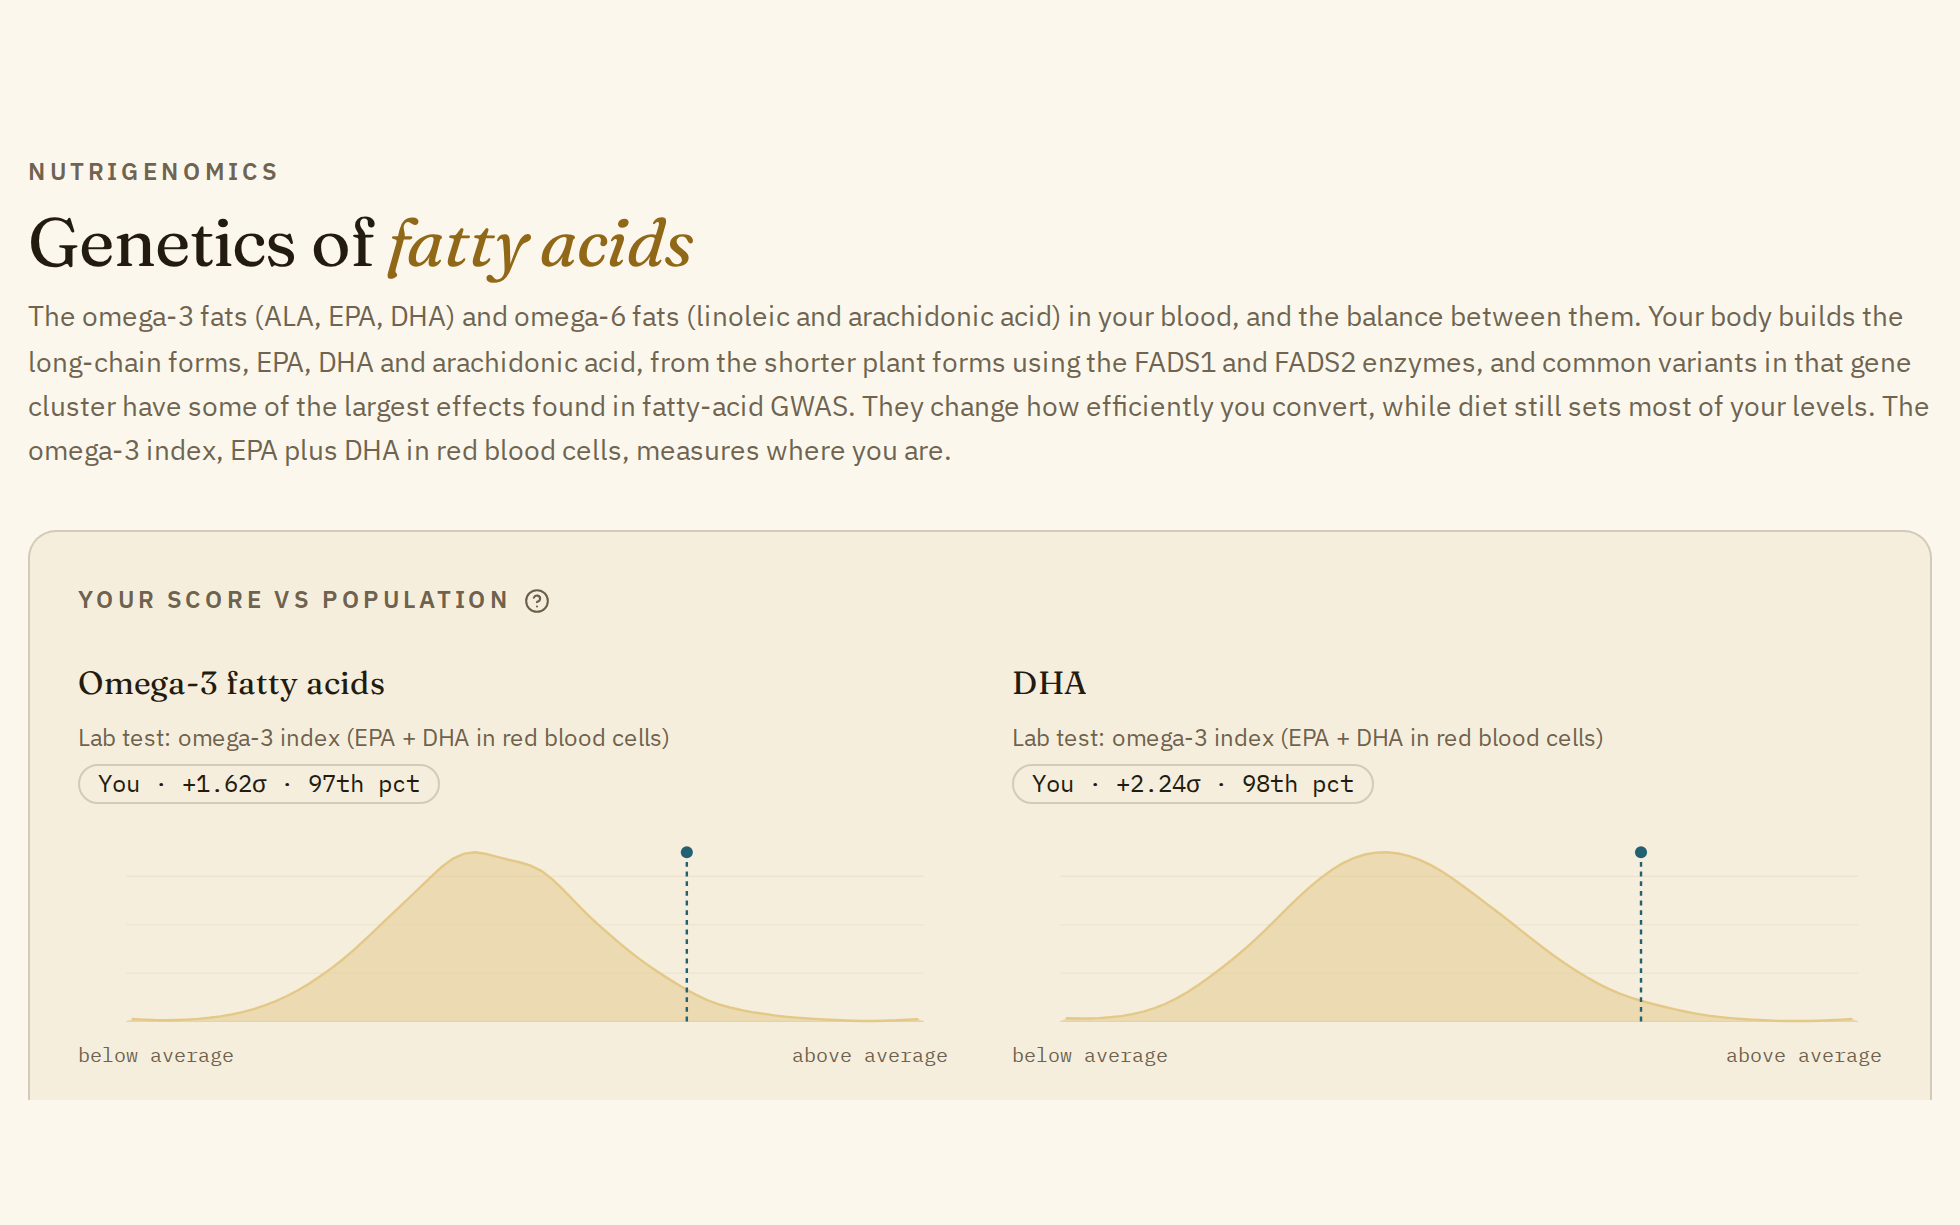
Some of the clearest results in a DNA report are about food. Seven pages in the left menu, under "Nutrigenomics", look at how your genes relate to nutrition, and Food tolerance is a good place to start.
Start with food tolerance
Food tolerance is where single variants have some of the largest effects, so its results are easier to read than most:
- Lactose: variants near the LCT gene largely decide whether the enzyme that digests milk sugar stays active into adulthood.
- Caffeine: CYP1A2 and other genes affect how quickly you clear caffeine.
- Alcohol: ADH1B and ALDH2 affect how your body breaks alcohol down. ALDH2*2 is common mainly in East Asian populations.
- Gluten: the celiac HLA types, DQ2.5 and DQ8. More on reading those below.
- Bitter taste: three variants in TAS2R38 affect how bitter some vegetables taste to you.
- Uric acid: SLC2A9 and ABCG2, two genes that handle how uric acid leaves the body.
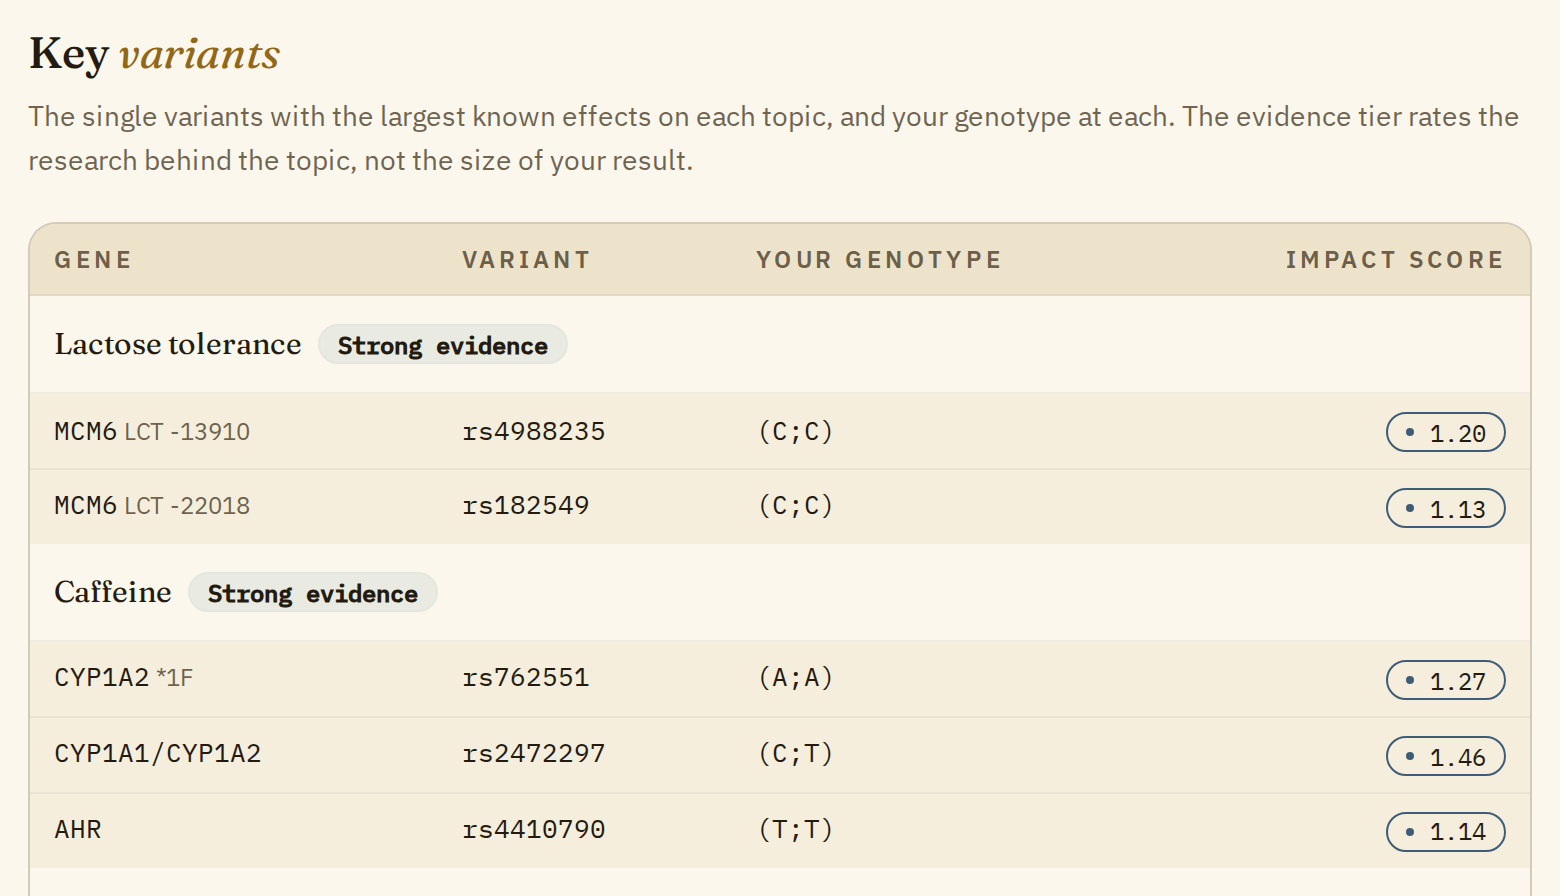
Each result opens a variant card with the full summary. Variant geno card explained walks through one.
The other six pages
- Fat-soluble vitamins: vitamins A, D, E and K, and the carotenoids your body turns into vitamin A.
- B vitamins & one-carbon: vitamin B12, folate and B6, and homocysteine, the main blood marker of the cycle that uses them.
- Iron metabolism: how your body absorbs, carries and stores iron, from ferritin to hepcidin.
- Minerals & electrolytes: calcium, magnesium, phosphate, sodium, potassium and copper, plus thyroid hormones as a stand-in for iodine.
- Fatty acids: omega-3 and omega-6 fats in your blood, and the balance between them.
- Amino acids & sports: glycine, the branched-chain amino acids, carnitine and creatinine, the molecules behind several popular sports supplements.
What the charts show
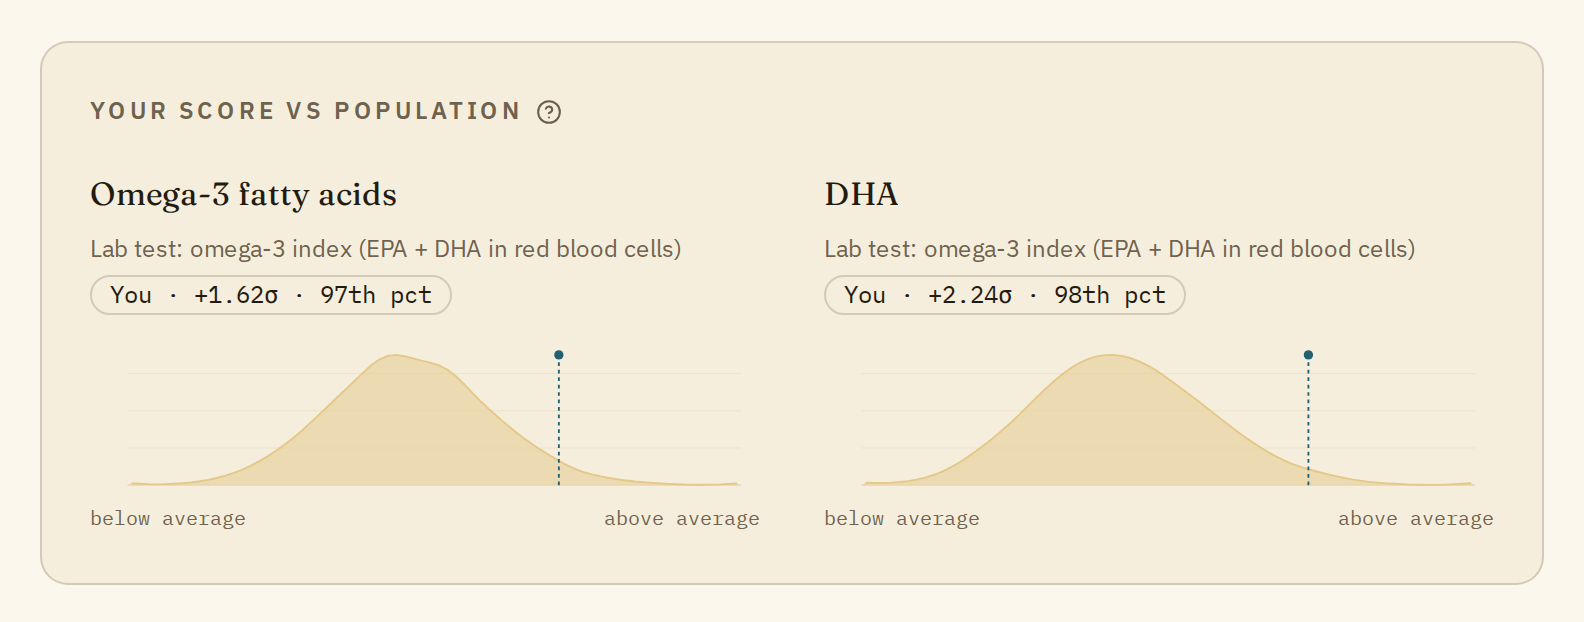
Each chart is a polygenic score built from published GWAS results in the GWAS Catalog, and your percentile ranks you against real scored genomes. It shows your inherited tendency toward a higher or lower blood level, a faster or slower conversion, or a different tolerance.
Under each chart's title is the name of the lab test that measures the same thing, such as the omega-3 index for omega-3 fats or serum 25-hydroxyvitamin D for vitamin D. We don't have your lab results; the name is there so you know which test to ask about. Your score shows a tendency, and only the test tells you your actual level. For most nutrients, diet, sunlight, body weight, medicines, kidney function and age explain more of the differences between people than genes do.
Key variants and evidence tiers
Below the charts, a table lists the single variants with the largest known effects on each topic, and your genotype at each, like the Food tolerance table above.
Each topic carries an evidence tier, which rates how solid the genetic research behind the topic is, not the size of your result:
- Strong: at least 10 replicated genetic loci, or one replicated variant with a large effect, found in studies of at least 50,000 people. Vitamin D, vitamin B12, iron, omega-3 conversion, lactose and caffeine are examples.
- Moderate: 2 to 9 replicated loci, or studies of 5,000 to 50,000 people. Vitamin A, vitamin E, vitamin B6 and magnesium are here.
- Weak: only suggestive or candidate-gene findings, or studies of fewer than 5,000 people. Vitamin K and the older folate-cycle candidates are here.
Strong evidence that a variant matters doesn't mean it matters much. The 13 known homocysteine loci, for example, together explain about 6% of the differences between people (van Meurs 2013).
A few gaps are stated on the pages themselves. Vitamin C has no report, because its main variant isn't in our variant database. Zinc and selenium have no scored report yet, and iodine has no genetic study of its own, so thyroid hormones stand in for it.
A few results that matter more
Most results here are small nudges, but a few carry clinical meaning, and the pages point them out:
- Two copies of HFE C282Y are the main cause of hereditary hemochromatosis (iron overload) in people of European ancestry. That result is worth discussing with a doctor and checking with ferritin and transferrin saturation tests.
- The celiac HLA types (DQ2.5 and DQ8) are common, and most carriers never develop celiac disease. Not carrying them makes celiac disease very unlikely, which is the more useful way to read them.
If one of these applies to you, confirm it with a doctor and the right test before drawing any conclusion.
How to read these pages
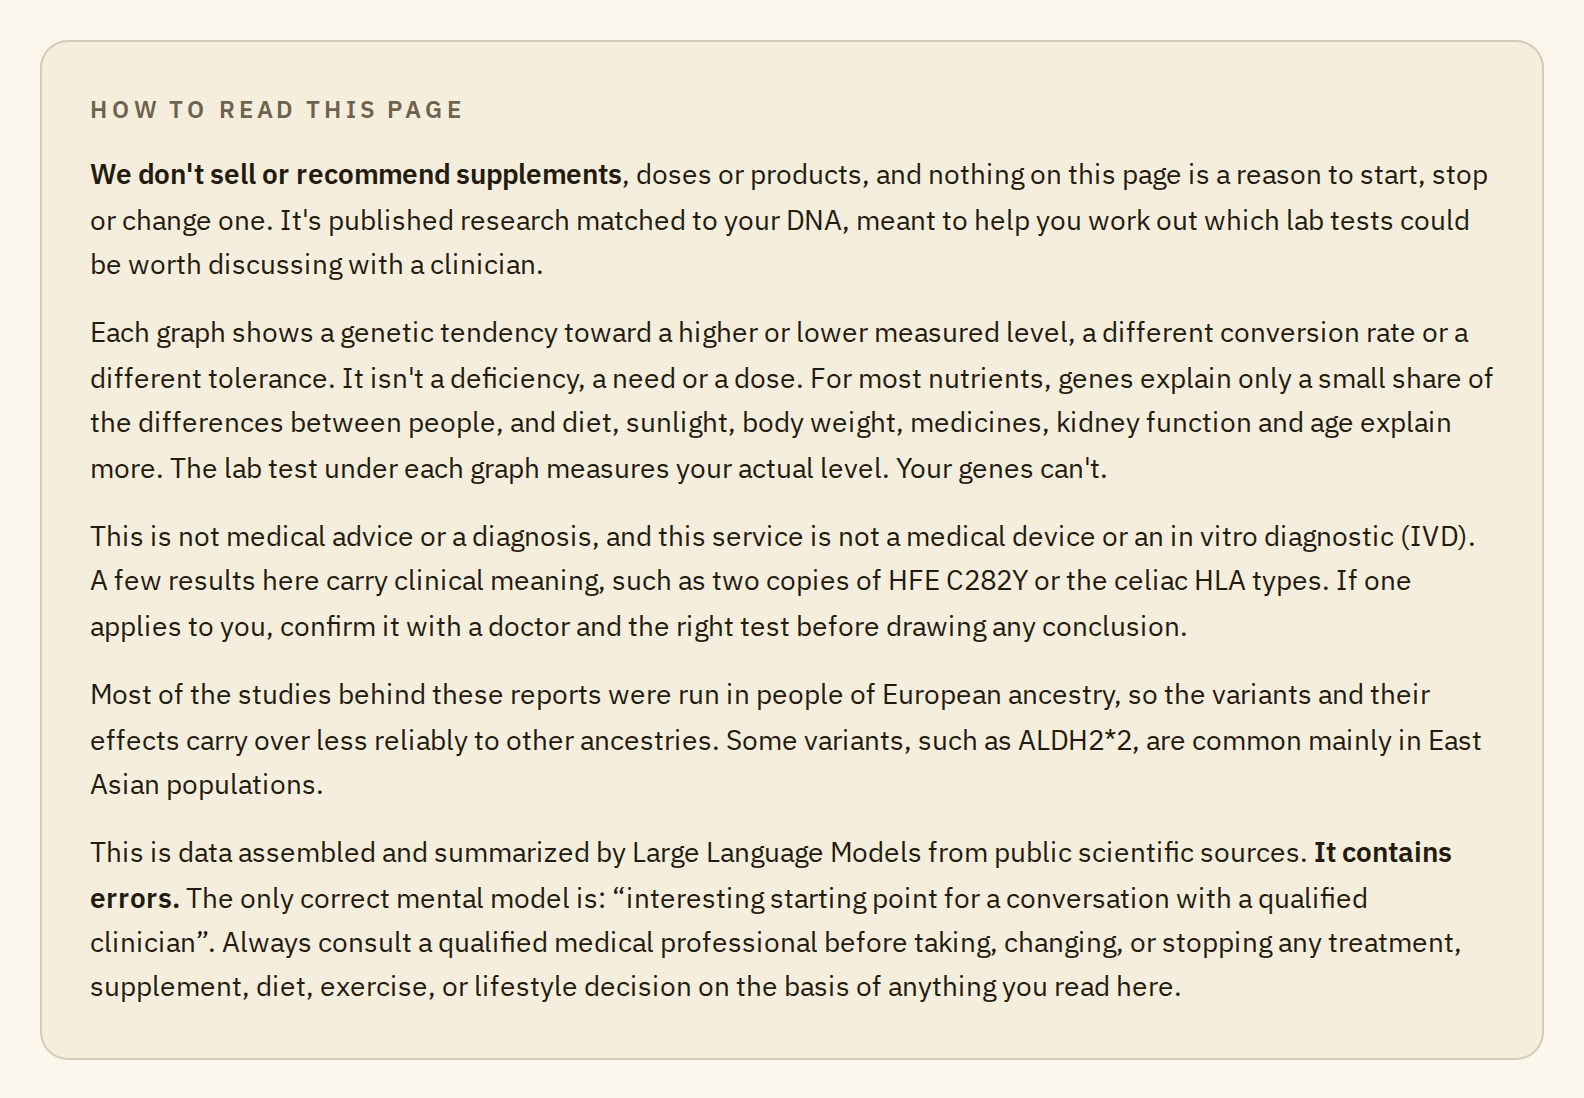
Every page ends with the same short note, and it's worth reading:
- We don't sell or recommend supplements, doses or products. Nothing on these pages is a reason to start, stop or change one. They're meant to help you work out which lab tests could be worth discussing with a clinician.
- A score isn't a deficiency, a need or a dose. It's a genetic tendency.
- Most of the studies were run in people of European ancestry, so the variants and their effects carry over less reliably to other ancestries. Some, such as ALDH2*2 for alcohol, are common mainly in East Asian populations.
One more thing
Think of these pages as an interesting starting point for a conversation with a qualified clinician. They're not medical advice or a diagnosis. This is data assembled and summarized by AI from public scientific sources. It may contain errors despite our automatic checks and manual reviews, which are ongoing given how much content there is.